
Data science: The science is in the detail
At Hivery when it comes to R&D engagements with our customers, we go through Discovery, Experiment and Deployment stages. Below we provide more concrete examples of internal practices beyond this birds-eye-view.
There are many companies today claiming to embrace the new data science era, but how many are falling prey to the hype in its diverse forms? In Data Science: the Business Picture we outlined how Data Science as a research activity can be fully incorporated into a business structure, ensuring that it adds value, improves performance and becomes a part of the company’s know-how.
However, Data Science is usually defined as a research process with steps like “data exploration”, “model building”, “training”, “validation”, etc. If we do data science, how do these steps fit into the overall picture? What are those?
Furthermore, there are several “camps” within data science claiming to know better how things should be done, at times pointing out shortcomings of the other side in not-the-most-constructive way. Which approach should we follow?
Quite frankly, it is not a matter of being right or wrong. What matters is delivering a solution to the business problem. From this perspective, every contribution is welcomed. Below you will find a proposal on the “link” between these processes based on my personal experience as an engineer and a data scientist.
Ideas from the world of statistics
There is a huge misconception about statistics. Statistics is believed to be arcane, overly complicated and at times out of touch. It is true that at the turn of the twentieth century statistics was applied to problems that seemed irrelevant to everyday practice. In its defense, I would say that this was possibly due to the fact that most “essential” issues had already been addressed. Moreover, due to the sophistication gained in other areas of mathematics entering the field (hence, the obsession with “advanced” topics), it became difficult for the uninitiated. Bottom line, if we want to introduce statistical concepts, we need to go back to the post World War II period. Once we do this, we can move into recent times to incorporate the state-of-the-art.
It was statistician J. Tukey who championed (circa 1961) what he called “Exploratory Data Analysis” – an approach to analysing data sets by summarising their main characteristics, often with visual methods. Tukey brought to mathematical statistics a concern echoed by many others at his time of taking a step back from often misused probability distributions, random processes and so on, and encouraged a more open-minded, flexible exploration of data.
In the same vein, G. Box (1976) wrote about cookbookery and mathematistry. The former Box described as “a tendency to force all problems into the molds of one or two routine techniques, insufficient thought being given to the real objectives of the investigation or to the relevance of the assumptions implied by the imposed method”. And the latter he definied as “characterized by [the] development of theory for theory’s sake, which since it seldom touches down with practice, has a tendency to redefine the problem rather than solve it.” Yes, this was written forty years ago, and how relevant it is even today!
However, there has been a number of recent efforts to bring statistical thinking to the masses. Fast forward fifty years and take David Blei’s “Build, Compute, Critique, Repeat: Data Analysis with Latent Variable Models” (2014), available here.
Blei takes Box’s ideas and puts them in today’s context. I wrote about them in the past and recently used them again in a presentation on Promotional Effectiveness R&D process for Coca-Cola Amatil
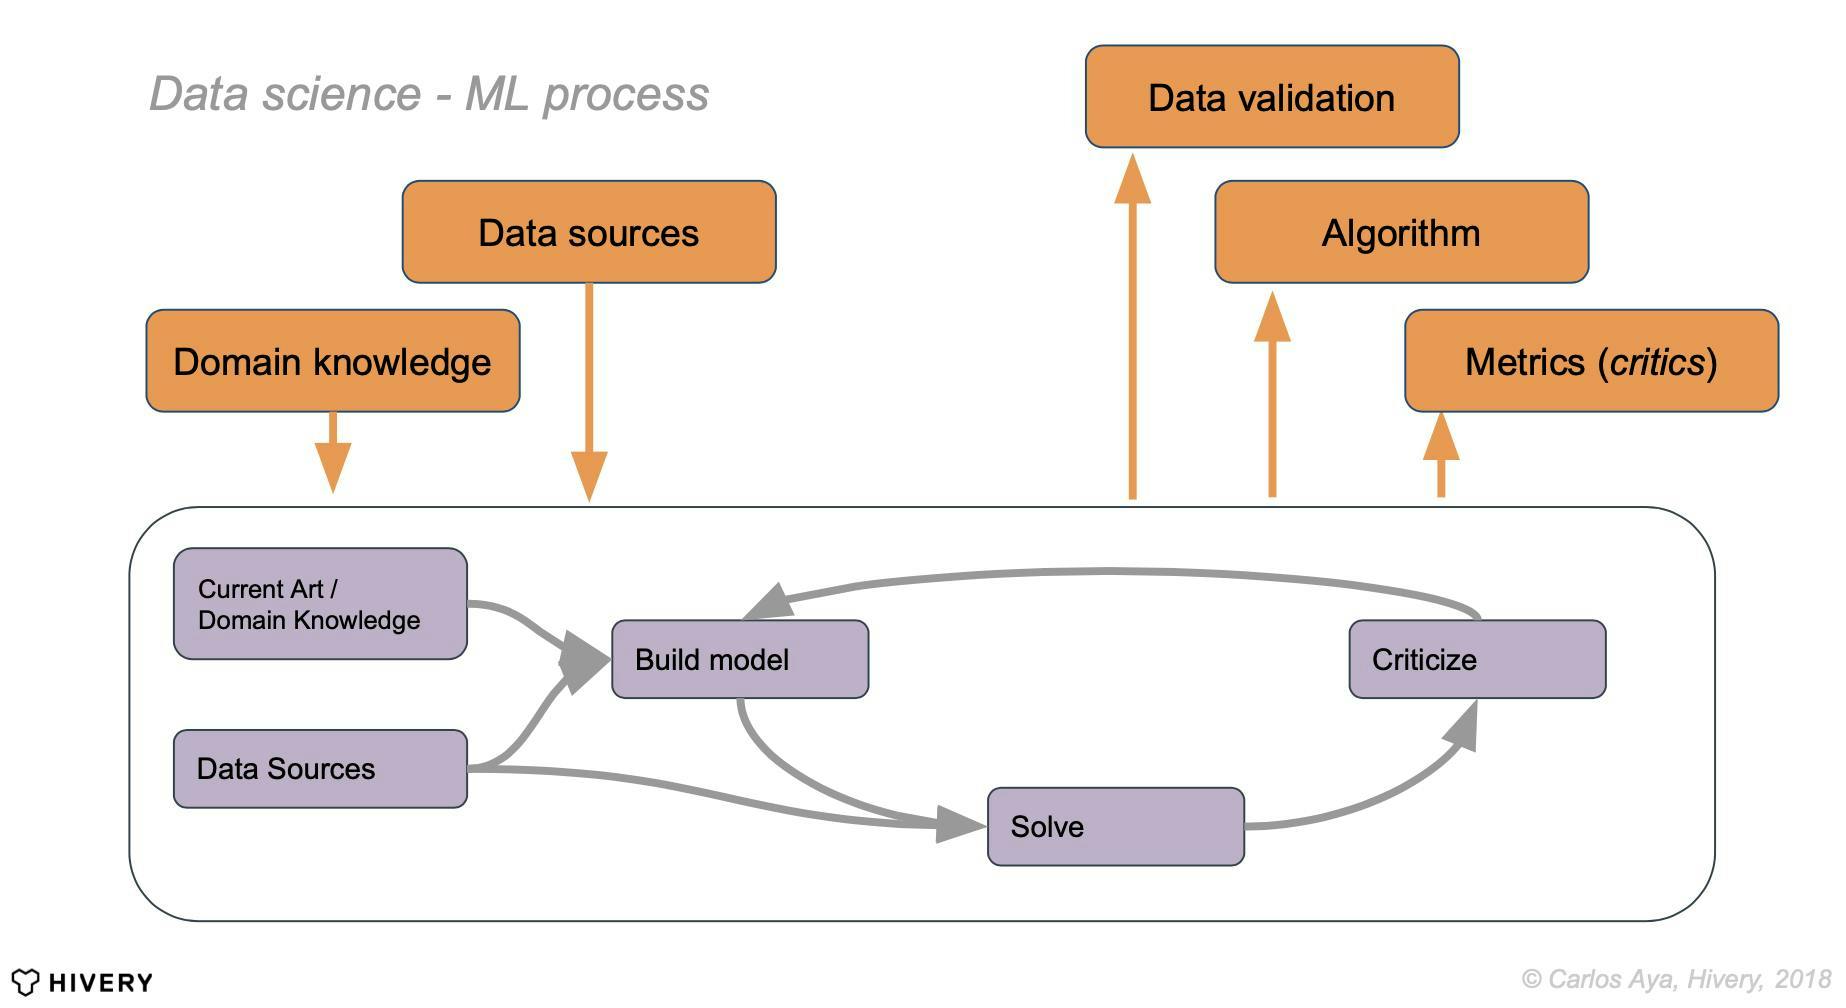
In essence, data sources and domain knowledge are inputs that a data scientist uses to (a) establish current art (and probably a baseline for the task), (b) formally (perhaps, in mathematical language) define data to be used, (c) theorise a model underlying the data, (d) propose a way to solve the model (the “learning” in Machine Learning), and finally (e) criticise the hypothesis based on certain principles.
Ideas from Machine Learning and Operations Research
Interestingly enough, the process is not much different in Machine Learning (ML). The key conceptual difference lies in the use of specific models, solvers and metrics. Statisticians, particularly from the Bayesian camp, would argue that most ML tools can be translated into a probabilistic setting, so this similarity shouldn’t come as a surprise. ML practitioners emphasize loss-metrics, the solution and not much (I dare to say) the inherent randomness in the process. But the principles are exactly the same!
Of course, Operations Research (OR) also brings its own methods and tools. There is, however, an interesting caveat: the available data usually does not carry knowledge about optimal actions, as the best possible action is not in the data. Hence, much of the optimisation work is based on existing baseline practices and the wealth of know-how from practitioners.
Ideas from other places
Finally, there are many sources of inspiration for novel algorithms and also a plethora of mathematical tools (and caveats) that come into play. Apart from the well-known Neural Networks (and its many variants including “deep” NN) there are other biology-inspired ideas, genetic algorithms, ant-colony optimisation, and many other ML/AI/Math tools from engineering or physics (i.e. DSP, PDE, etc.) that we could try or that might be needed.
As I said above, if we first do the required stroll through history, we can later apply the state-of-the-art techniques. For instance, approaches inspired from quantum physics (e.g. Qbism) have been recently gaining traction, as they seem to address some paradoxes found in decision theory that challenge the idea of a “rational” player. However, in the end, all needs to follow the process which I outline further below. And, yes, we need to start from the bottom of the mountain if we want to reach its peak.
The process and/or structure
Based on all the above, here are some concrete procedures to follow. There is one input that triggers the data science engine: a project scope. It should include the following elements:
- Problem statement: a succinct problem statement in black and white
- Stakeholders: one stakeholder should be nominated as the “product owner” as per Agile methodology
- Relevant context: includes all assumptions and forethought on exceptions or further implications
- Success criteria
- Timeframe
Problem statement step aims to define the data available to tackle the problem of interest. By making this step first, we highlight something that every software developer knows – early decisions made during development stage have greater impact down the line. So, contrary to data lacks advocates, I have experienced first hand the impact of data sources changing shape during the research phase and even worse – implementation. Not that we cannot change, but there are costs. On the other hand, solutions should be specific, and we should avoid falling in the trap of YAGNI (You Ain’t Gonna Need It). Yep, data science can be overengineered.
We included in Stakeholders step what agile practitioners call “Product Owner” because, as with any software development, we believe communication is key to success in poorly defined and open-ended problems, like here in data science. A Product Owner gives a data scientist a much needed anchor to avoid wasting time on solving problems that do not add value.
Relevant context step mirrors Tukey’s exploratory data analysis. Adding a little bit of academic foundation: as with any research activity, a thorough literature and industry exploration should accompany the initial work with the data before jumping to the modelling stage.
Success criteria step should include an approach that covers a model-centric, a loss-centric (ML) or a utility-based (OR) approach. We use “Model definition” as in Blei’s paper, but we mean to include all these views. Model definition must be read with an open mind. Regardless of the approach, it should be noted that we expect a data scientist (or team) to produce a way to algorithmically solve the model from the given data. Intractable formulations, although beautiful theoretically, are of course unacceptable.
Steps above must be followed by healthy [self]criticism. There are several strategies that can be used (mainly from Blei’s paper):
- Model-centric criticism strategies
undefinedundefinedundefined - Loss-centric criticism strategies (ML)
undefinedundefinedundefined - Generic criticism strategies
undefinedundefinedundefinedundefined
A way to foster this healthy [self]criticism is to establish a peer-review step within the data science team. It is similar in nature to code reviews in software and sits well within the Agile process. In this step, a data scientist produces an internal report on findings (say, a simplified model) that gets peer-reviewed by colleagues. This does not need to be sophisticated and can be as simple as publishing a notebook in a version control system (i.e. github) via a Pull-Request.
Apart from a purely qualitative aspect, Criticism also feeds the Maintenance reports. For instance, some criticism strategies can be automated as regular performance reports.
Finally, Closure step (of a given cycle) defines two important outcomes: a sign off and a kick off. If the whole process has been developed in constant consultation with the business and data engineering teams, this step shouldn’t be a burden, and it is good that it is written in black and white.
First, the R&D process is signed off. The Product Owner and by extension the business has to be happy with the overall proposed solution, its limitations and strengths. For the sake of stakeholders’ understanding (our customers) this involves:
- Jargon-free, business-relevant details of the model; usually delivered in a presentation
- Some cursory results on how the expected solution looks like (again, presented to stakeholders)
- Jargon-free data commitments (i.e. what sort of data needs to be provided on a regular basis to make it “tick”)
On the other hand, the data engineering team should understand the solution from top to bottom. They will probably take the algorithms and rewrite them from scratch in whatever technology stack they used to make them “production ready”. There is, therefore, an Implementation kick off meeting. For the engineering team, a data scientist produces:
- data validation criteria
- an algorithm to “solve” the model along with its mathematical description (so it can be rewritten in other programming language, if required)
- a number of “critics” (metrics) to monitor performance
Now the roles are inverted. Before the engineering team offered advice in terms of performance and resource limitations in any solution being proposed. But during implementation and deployment, the data science team acts as an internal consultant assisting the data and infrastructure teams with any unforeseen issues and ensuring the faithfulness in implementation of the initially developed algorithms.
All parties – business, data science and engineering teams – should be aware of the parallel “herd of critiques”, the third deliverable mentioned above. It means that from all the criticisms proposed, the most important ones should be picked for the ongoing maintenance and monitoring. These are added to the Implementation kick off and are deployed as service monitors along with other traditional DevOps metrics. They are a safety net that ensures the mathematical foundations are still current as new data arrives and close the feedback loop with the data science function so necessary actions can be taken if problems are detected.
Finally, in the same way that a company demands from product/project managers an overview of current projects and customer engagements, the data science or machine learning team should report on overall research status, road map progress and deliver some sort of data science report with status of selected performance metrics for deployed algorithms across the board. Above can be operationalised in monthly status reports, and I would suggest to implement this practice in data science as well it is usually done in other areas of the business.